CARBON STUDY: WHAT IS THE IMPACT ON JAZZ VENUES AND FESTIVALS? | An AJC – Périscope study in the framework of Footprints
- By Gwendolenn Sharp
- April 2022

A roadmap for the jazz industry to address the climate crisis
It is now scientifically proven that climate change is the result of anthropogenic greenhouse gas (GHG) emissions and these future emissions will determine the evolution of the climate in the next coming years. In order to not exceed an increase of 1.5°C by 2100, we must rapidly curb our emissions to reach a net zero by 2050. Following the process towards a une Transition Bas Carbone initiée par le Périscopei and the presentation of its carbon strategyii in early 2022, a new cooperation between Le Periscope and the AJC network has started in 2021. The goal of this initiative is to design a carbon study, to measure the impact of our industry on climate change and to create a common trajectory in the field of jazz and improvised music.
Conducted thanks to a European co-funding, this Periscope-Footprints and AJC carbon study aims to determine the carbon footprints of different operators (members of the network or partners), then to identify the most relevant reduction factors for each of them and, more generally, to define reproducible strategies for the other operators in the industry.

Over the last ten years, the cultural sector has become progressively aware of its impact on the global climate crisis. Pioneers such as Julie’s Bicycle in England and Creative Carbon Scotland are supporting actors in their efforts to decarbonise, using carbon calculation tools designed for the cultural sector and through ongoing studies. In France, the thinking process started in the performing arts sector at the beginning of the 2010s, with the conduct of a series of carbon assessments for a few theatres and large venues. It has especially accelerated since 2020, with the publication of the Shift Project report, a general desire to reorganise post-Covid 19 practices in order to make them fundamentally more sustainable and to finally give easier access to national and European funding for the implementation of carbon audits.
However, despite numerous experiments and a number of studies, the cultural sector, and the music sector in particular, still lacks a quantified and scientific approach to measure and understand the issues related to its activities. European and French legislation is beginning to evolve, including the obligation to display the environmental impact of its activities, such as the various pressures. In addition to the recognition of the prescriptive role of culture, these measures should lead us to anticipate these questions and to start our transition as soon as possible to contribute to the fight against the climate crisis.
Le Périscope, leader of the Footprints European cooperation project, and the AJC network are affirming their desire to provide a new methodology for the operators, involving all the links in the current music ecosystem- producers, artists, presenters- in order to think collectively and make concrete progress in the low-carbon transition of the jazz world.
This study should enable the jazz and improvised music sector to first understand its emission factors and then examine how to reduce them. It aims to clearly identify a set of defined and measurable targets that the sector as a whole could adopt in order to play its part in the Paris Agreement on climate change, through a national reflection fuelled by European comparisons and a balanced view of the jazz industry in France and Europe.
Methodology
A sample of venues and festivals representative of the diversity of our sector
| Nom | Code* | Typologie | Localisation (pays & typologie) nbr d’habitants par aire urbaine |
|---|---|---|---|
| Le Périscope | A | Venue, medium | FR, city-center Metropolis : 1 400 000 |
| L’Estran | B | Venue, medium | FR, rural Village : 12 000 |
| L’Astrada | C | Venue, medium | FR, rural Village : 1250 Association of communities : 7000 |
| Bimhuis | D | Venue, large | NL, city-center Metropolis : 1 350 000 |
| Jazzdor | E | Festival, medium | FR, city-center Large city : 500 510 |
| Les Détours de Babel | F | Festival + venue, medium | FR, city-center Large city : 450 000 |
| Oslo Jazz Festival | G | Festival, medium | NO, city-center Metropolis : 690 000 |
| Jazz à Luz | H | Festival, small | FR, rural Village : 1000 |
| Jazz dans le Bocage | I | Festival, small | FR, rural, nomadic 1000 inhabitants per village in average |
The reference year chosen is 2019. In fact, following the consequences of the health crisis since March 2020, it represents the last year of “normal” activity and attendance for the operators, and therefore makes it possible to extract data that are relatively consistent with a normal operation.
A methodology that considers the specific nature of our activities, in particular the travel of our audience and the tours of our performers
The carbon footprint methodology, published by ADEME in 2004, can be used to measure greenhouse gas emissions, i.e. the impact on climate change of any organisation. It includes all the greenhouse gases defined by the IPCC (Intergovernmental Panel on Climate Change) for all its flows, and its fields of application are divided into 3 categories of emissions called scopes 1, 2 and 3. The practicality of the carbon footprint tool and its relative flexibility make it possible to be adapted to the specific characteristics of our sectors of activity.
The first phase of our methodological work consisted of listing and examining all the topics that have a direct or indirect impact on our sector. According to the different scopes described below, the least relevant ones were discarded. Thus, due to their minimal impact in terms of carbon impact, inputs such as paper and digital activities (emails, internet, etc.) were considered too small to be included.
| | Description | Included emission sources | Excluded emission sources |
|---|---|---|---|
| SCOPE 1 | Emissions from assets held or exploited, i.e. oil heating, gaz furnace, vehicles owned by the structure, generators… | – Natural gas combustion – Freezing agent leaks | |
| SCOPE 2 | Emissions from the energy you buy (produced elsewhere), i.e. electricity | -Electricity | |
| SCOPE 3 | Emissions from other sources: professional travels, products and services you buy, travels, food, waste treatment, investments, travels of audiences… | – Upstream use of electricity – Food, advertising medium, digital – Computer equipment (for venues) / Property (amortisation, for venues A, B, C, the only ones affected) – Artists / employed professionals / professional visitors travels – Travels of audiences – Travels home-work of permanent staff and volunteers | – Packaging / waste (low compared to other sources) – Freight and works transport (low more often than not) – Assets under leasing (not much affected) – End of life (not much affected) – Digital broadcast (low compared to other sources) |
This phase revealed a number of difficulties and required us to make some choices in order to be as coherent as possible. It was, for example, complicated to include the premises and their fixed assets for the festivals, the vast majority of which do not own any venues. On the other hand, the entire ecosystem was taken into account for the “venues” participating in the study, which does not allow direct comparisons between the two types of presenters.
To guide venues and festivals in collecting data in the most coordinated and consistent way possible, a collection file has been created. It consists of a questionnaire to be filled in, with cumulative data for 2019, the reference year:
- Purchases of electricity, natural gas
- Estimation of paper/cardboard consumption, meals distributed and digital activity
- Estimation of various types of travel (in-season audiences, out-of-season audiences, artists, regular staff, volunteers, visitors, inbound and outbound freight)
- Balance sheet of fixed assets as at 31 December: buildings owned (rooms A, B and C) + computer equipment
Artists’ travel: a high accuracy measurement method for a key issue in the various projects
A calculation tool has been created to record all travel for each scheduled concert date:
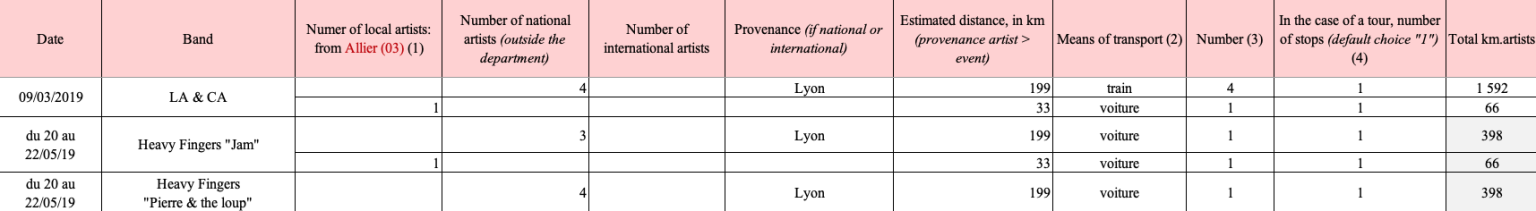
The calculation formula (to be calculated separately for each different means of transportation used within the team), allows the addition of 2 types of travel:
- The round trip from the city of origin: Number of artists x estimated round trip distance / number of stops on the tour
- Travel between tour stops: Number of artists x estimated average distance between 2 stops
Public mobility: a statistical analysis as close as possible to the reality of the territories
- Regarding public travel, a distance calculation tool listing all the trips for each type of travel (urban, regional, national, international) was also sent to the organisations participating in the study. The calculation method, for each typology of travel determines:
- The average distance travelled per trip category
The modal share, i.e. the part taken by the different modes of transportation (walking, cycling, bus, metro, TER, train, TGV, car…), as a % of the km travelled
Calculation by mode of transportation and by type of trip: number of spectators * average distance travelled * % modal share = number of passengers.km
It should be noted that there is some uncertainty in the total distances calculated, due to two main factors:
- Uncertainty on the average distance per trip type: statistical data or estimates by the different venues/festivals
- Uncertainty on the modal share per trip type (statistical data or estimates by the different venues/festivals)
This aspect underlines the importance of conducting studies on the mobility of the public, by site or typology of site, in order to refine the data and the related emission rates.
Once all the data have been collected, they are verified and then processed to calculate the results. The calculation of the GHG balance was performed using the Association Bilan Carbone v8 (2020) spreadsheet, which takes into account the emission factors (coefficients used to convert activity data into GHG emissions) 2018-19iii. This preparatory work was carried out between April 2021 and November 2021.
It is this initial phase, and the exchanges made between December 2021 and today, that make this type of joint study so rich: understanding an issue by highlighting the different realities and being able to extract measurable data.
The figure of the study
The carbon footprints of the various festivals and venues show great disparities between the sites. For the year 2019, it goes from 39t CO2eq for a nomadic festival in a rural area to 546t CO2eq for a venue in an urban area.
| Code | Typologie | Emissions GES 2019 totales | Nombre de spectateur·rices / an | Données émissions GES manquantes |
|---|---|---|---|---|
| A Le Périscope | Venue, medium | 63 tonnes CO2e | 11 498 | |
| B L’Estran | Venue, medium | 141 tonnes CO2e | 10 031 | |
| C L’Astrada | Venue, medium | 193 tonnes CO2e | 13 663 | |
| D Bimhuis | Venue, large | 546 tonnes CO2e | 50 659 | |
| E Jazzdor | Festival, medium | 90 tonnes CO2e | 8 366 | Food and venues |
| F Les Détours de Babel | Festival + venue, medium | 68 tonnes CO2e | 20 857 | Food and venues |
| G Oslo Jazz Festival | Festival, medium | 318 tonnes CO2e | 20 146 | Food and venues |
| H Jazz à Luz | Festival, small | 77 tonnes CO2e | 7 543 | Venues |
| I Jazz dans le Bocage | Festival, small | 39 tonnes CO2e | 5 409 | Venues |
On average, the French venues studied have a balance of about 100t CO2eq, which remains a rather low level of emissions. For comparison, since the last update in October 2021 by the Ministry of Ecological Transitioniv, the average carbon footprint in France in 2019– the last year of calculation before COVID-19- is 9.0t CO2eq per person.
The average balance of the European sites is 430 t CO2eq, which is about four times higher than the French sites. This difference is partly explained by the low carbon proportion of the electricity mix in France.
Even though the use of nuclear energy raises other environmental challenges, it has very low carbon emissions, unlike the energy mix in other European countries, including Norway and the Netherlands, which still relies heavily on fossil fuels (natural gas, oil, coal). The European venues studied also host a large number of events and spectators. The travel of spectators by car and artists by plane have a strong impact on their balance. While the Netherlands is very well served by rail, connections with Norway are more likely to be by air, and the size of the country means that there are long distances to cover.
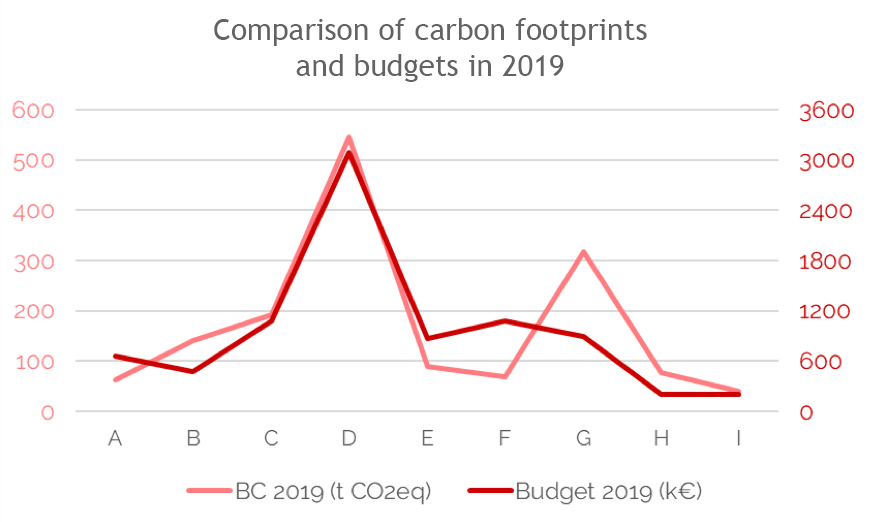
Once the figures have been compiled, it is relevant to convert them into a common reference unit in order to provide the first elements of comparison. Three benchmarks have been chosen: the annual budget, the number of operating days and the number of performances. Other criteria are also possiblev.
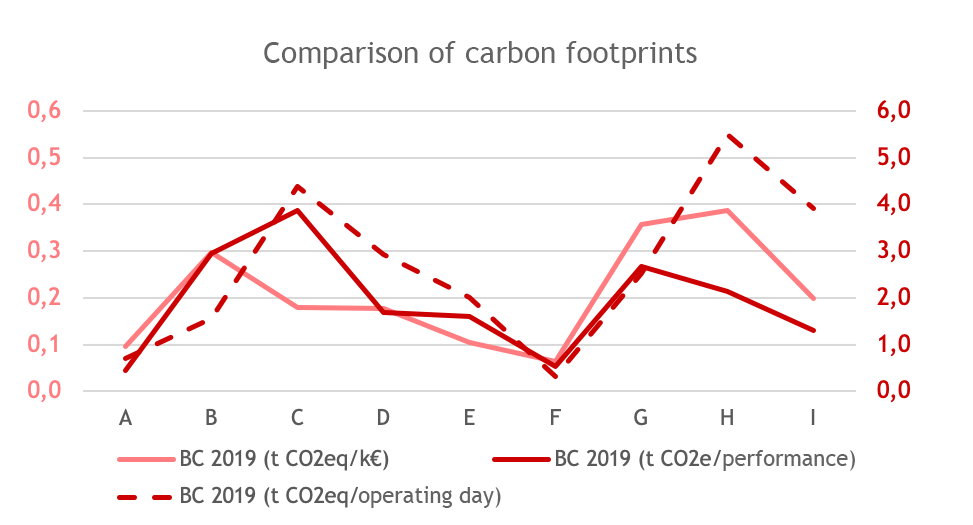
The sites with the greatest impact are those with the highest number of audience trips by car, or the lowest number of operating days. On the other hand, there is no direct proportionality between the operators’ annual budget and their carbon footprint: its intensity varies between 0.1 and 0.4 t CO2eq per k€ of budget.
Comparison of festivals
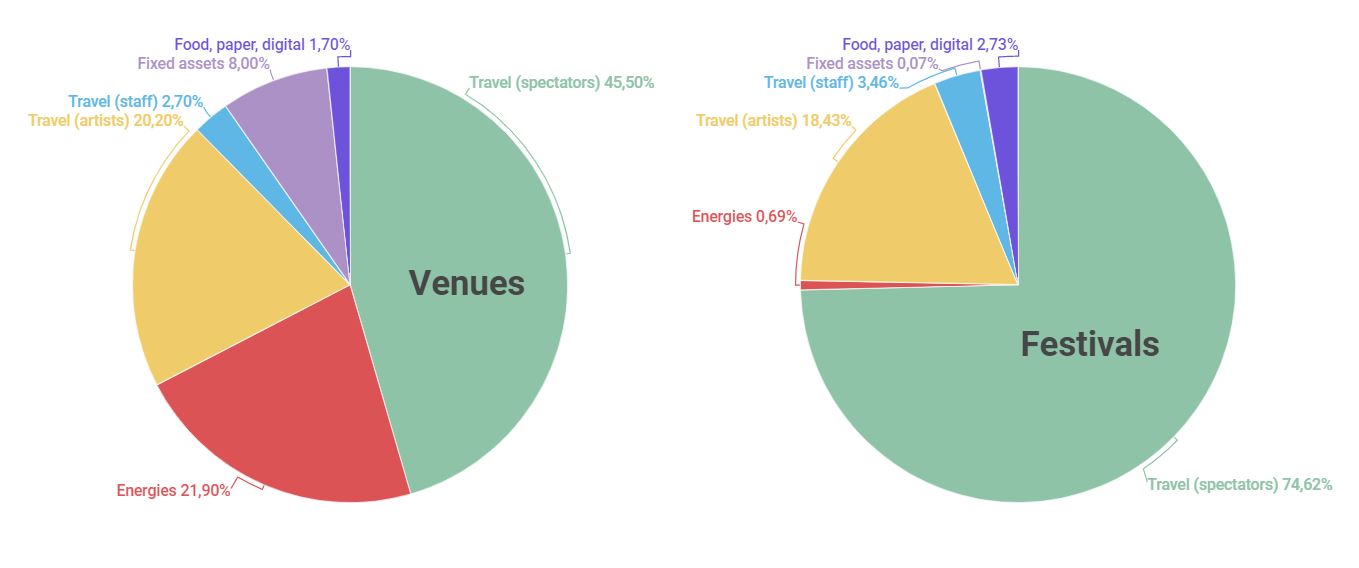
The 4 venues studied have an average carbon footprint of 236t CO2eq, with the following repartition:
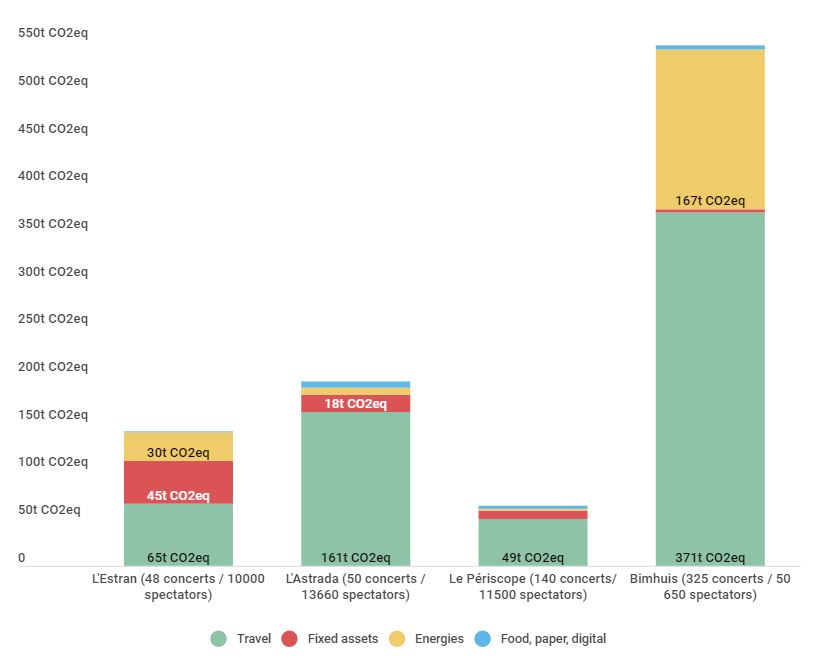
For venues, there is a major impact of travel (mainly of audiences by road and artists by air). Fixed assets, which include those of the premises and are calculated on the basis of work carried out over the last 20 years, also account for a large share.
Inputs, on the other hand (mainly meals, paper and digital activities), account for only a small part of the carbon footprint.
The 4 festivals observed have an average carbon footprint of 118t CO2eq, with the following repartition:
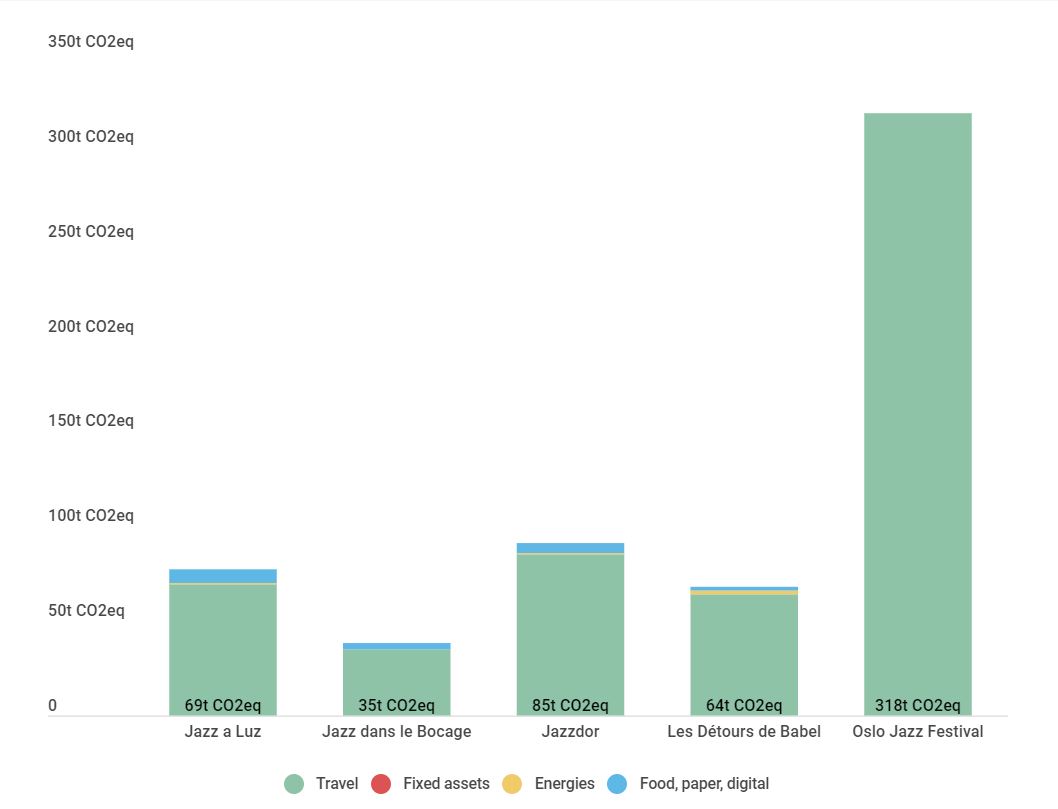
For the festivals, we also observe, not surprisingly, a major impact of travel, mainly by car (audiences). The impact of energy 1+2 is relatively low, as the data were not available for the Norwegian festival, and the other festivals operate on 100% electric power (a highly decarbonised mix, as mentioned earlier).
The non-energy impacts do not apply to this type of site. The impacts of inputs remain relatively minor (62% of them concern food, 31% paper and 7% digital activities). Fixed assets only concern IT equipment.
Without pitting venues against festivals, this last point highlights the energy impact of the premises and this issue is therefore very important for the venues.
For French venues, fixed assets represent on average 19% of the carbon footprint.
The analysis needs to be completed for festivals, with refined data collection on the facilities they use.
Unsurprisingly, travel is the largest source of emissions from our activities.. On average, they represent 83% of the carbon footprints in the study (69% for venues, 94% for festivals).
However, it is necessary to differentiate the mobility of artists and the mobility of audiences in order to correctly assess their respective impacts and to activate the appropriate levers, while preserving the core of the operation. The contextualisation, particularly around “white zones” and modal shift, is crucial when looking at the panel in rural areas.
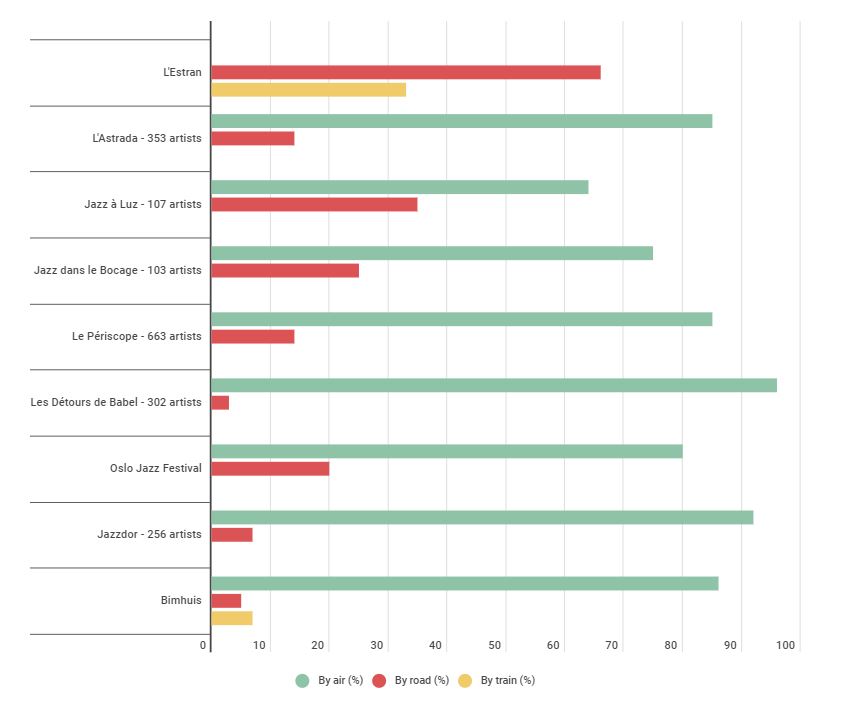
Artists’ travel (including professional artists and their staff) represents 27% of all trips. 67% of travel is by audiences and 6% is by employees travelling to and from work.
In rural areas, audience travel accounts for 74% of all travel (mostly by car), compared with 17% by artists and 9% for home-to-work travel. In urban areas, 62% of the trips are made by audiences, 34% by artists, and another 4% by commuting.
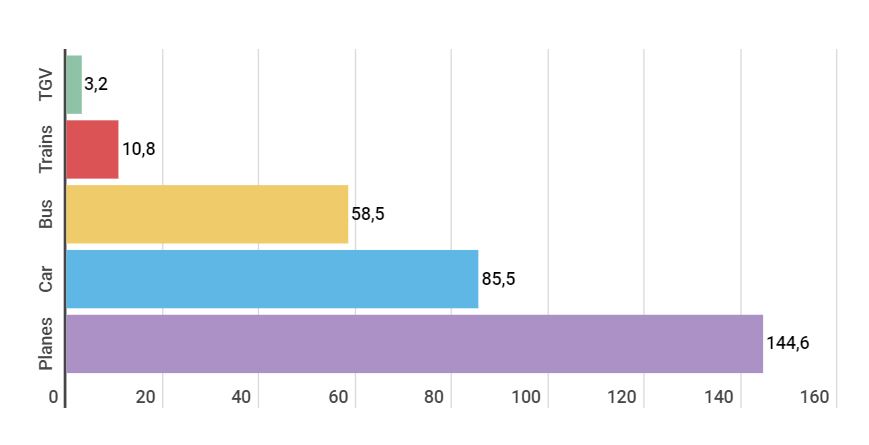
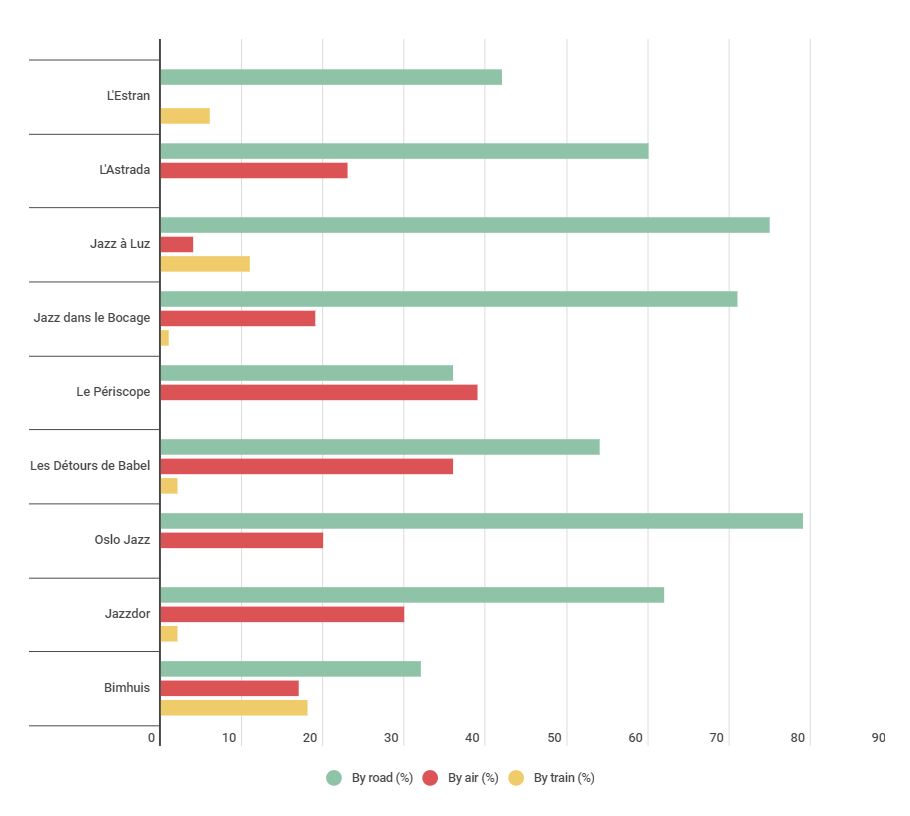
The comparison of transport emissions provided by ADEME, which compares the impact of transportation by air, car and train, helps to understand the strong impact of air travel on a study like ours.
The car is the means of transportation used the most by the public while the plane is the one used the most by the artists, with the exception of a place like L’Estran (few international artists in 2019).
As some venues and festivals are very far from public transportation infrastructures, the modal shift from air or car to train is often impossible or very difficult.
What are the outcomes ?
Means of action and studies to be continued
This first study highlights the continuing requirements in terms of data collection and refinement.
It outlines a few possible guidelines for work and levers for actions.
| Transports des publics | Proposer une plate-forme de covoiturage, pour diminuer de 30 à 50% le nombre de voitures (3 passagers/voiture) | Moyen | 5k€ | -20 à -30% sur le poste « déplacements publics » |
| Energie | Changer de fournisseur d’électricité, vers un mix encore plus décarboné | Facile | Facile Coût +5 à +20% par kWh | -50 à -80% selon mix choisi sur poste « électricité » et/ou « gaz » |
| Energie | Baisser le chauffage en salle de 2°C en hiver, et la clim de 2°C en été | Moyen | Conso -5 à 10% | -10% sur poste « électricité » et/ou « gaz » |
| Achats | Réduire de 20% la communication papier | Moyen | -20% coûts en papier | -20% sur poste « papier » |
| Achats | Mettre à disposition davantage de repas végétariens (2/3 du total) & locaux | Facile | -20% coût des « repas » | -50% sur poste « repas » |
| Transports des artistes | Pour les artistes nationaux & EU, remplacer 50% des déplacements voiture, ou avion par des déplacements en train | Moyen | Augmentation significative des coûts de transport (train VS voiture) | -30% à -40% sur le poste « déplacements artistes » |
| Transports des artistes | Eviter les exclusivité et mutualiser les tournées d’artistes étrangers avec d’autres structures OU proposer + de dates / lieu | Difficile | NC | -20% à -30% sur le poste « déplacements artistes » |
Venues, festivals and producers can act collectively on the mobility of artists. On the other hand, their means of action remain limited when it comes to the mobility of audiences, the most important emission source. Local authorities and public policies must act in this direction to support the decarbonisation of our industry.
Presenters have different levers of action to act on the following inputs: audiences, purchases, energy, artists, food. These decarbonisation measures are also presented in the Shift Project report, with quantified reduction potentials.
They offer interesting approaches to work on, even if they are not necessarily all adapted to our realities on the ground, for example regarding the freightvi.
For the AJC network and Periscope, the work of collecting and refining data must be continued, particularly on audience travel (through mobility studies), the use of premises by festivals, and catering.
Collective actions for the worlds of jazz and the entire cultural sector

In order to achieve their transition objectives and make the necessary transformations, the protagonists of the music ecosystem will have to change the practices in their respective fields.
By working collectively, in cooperation with networks and partner organisations, and using existing resources, the aim is to strengthen existing approaches and develop action plans to support and implement the decarbonisation of the sector. The entire ecosystem has a role to play in encouraging public policies and local authorities to work in this direction.
The prescriptive role of the cultural sector, its capacity for experimentation and creativity, are undeniable assets that must be harnessed in conjunction with the sector’s recovery from the pandemic.
This collaborative work raises issues related to a policy framework that we must collectively grasp:
- – Deepening the connection between the size of our facilities, the proximity issues that we carry with environmental issues
– Linking ecology and societal economy to cultural issues in a more significant way in order to control our carbon costs, and to maintain a societal/cultural efficiency that is essential today.
- – Deepening the connection between the size of our facilities, the proximity issues that we carry with environmental issues
This work demonstrates once again the value of observation in setting up coherent strategies. It is essential today to know and assume the ecological impacts of our projects.
One of the solutions to complying with our ecological commitments is that the venues and events that we support should be adapted in size to the territories and their networks, that they should be involved in a process of sharing tours, defending the widest possible artistic diversity and sharing music with as many people as possible, and with a relatively low carbon cost.
Written by Gwendoleen Sharp
Translated by Aurore Bunel
References
[ii] Le Périscope’s carbon strategy is available at this link
[iii] Main hypothesis:
– Electricity: French mix EDF 2019 or national mix 2019 for foreign countries
– Natural gas: average national mix (consumption)
– Modal mix for travels: hypothesis or national/regional official numbers (great uncertainty)
– Travel by car: average motorisation, 2018, France
– Travel by air: long-haul flight and short-haul flight, with drag, France
– Travel by regional trains: TER 2019 or TGV 2019, France
– Real estate: hypothesis concrete building (amortisation: 20 years or 50 years if specified) or light metal structure (amortisation: 5 years)
[v] For other criteria, p.17 of Le Périscope’s carbon strategy
[vi] Shift Project, « Décarboner la Culture », pp. 50 à 72